Small cap. Mid cap. Large cap. These terms are everywhere. Index managers, fund managers, exchange-traded funds, all use them. Investors of all stripes use them. What's interesting is -- the definition of what constitutes a small, a mid, or a large cap company hasn't changed in decades. Is it time to rewrite these definitions?
August 6, 2021
Small cap. Mid cap. Large cap. These terms are widely used, and there’s even consensus on how to define them.
Market cap, where “cap” is shorthand for capitalization, is the value assigned by the market to a company. It is calculated by multiplying the total number of shares of a company by its share price. The commonly used categories and their definitions are below:
| Category | Market Capitalization Range |
| Mega Cap | Greater than $200 Billion |
| Large Cap | $10 Billion to $200 Billion |
| Mid Cap | $2 Billion to $10 Billion |
| Small Cap | $300 million to $2 Billion |
These capitalization levels are supposed to provide a rough idea of what one might expect from a company. So for instance, a “small cap” suggests — as the name on the tin — a small company that’s potentially risky but perhaps with more opportunity for growth. On the other hand, a “large cap” indicates an established and stable business, but perhaps with somewhat less room for growth. Furthermore, these categories are used by index owners, fund managers, and exchange-traded funds to define and describe their investment philosophies.

But while we are so accustomed to seeing these terms and associating meaning subconsciously, it is worth noting that not everything is what we might think it is. So, for instance, not all “mega caps” are slow growers and not all large caps are stable, slow-growing businesses. Sometimes, small caps are durable, slow-moving businesses with dividends. These small caps tend to be small companies in size because they might be operating in a niche market!
But I have an even broader issue with these categories: these market cap ranges have not changed in donkey’s years! However, as we all know, over time, Mr. Market goes up, which means the size of the average company goes up over time. So, my point is, today’s $10 Billion market cap isn’t the same thing as a $10 Billion market cap 30-years ago. After all, today’s car is not the same as those made 30 years ago, and a $100 bill today buys a lot less than $100 bill three decades ago.
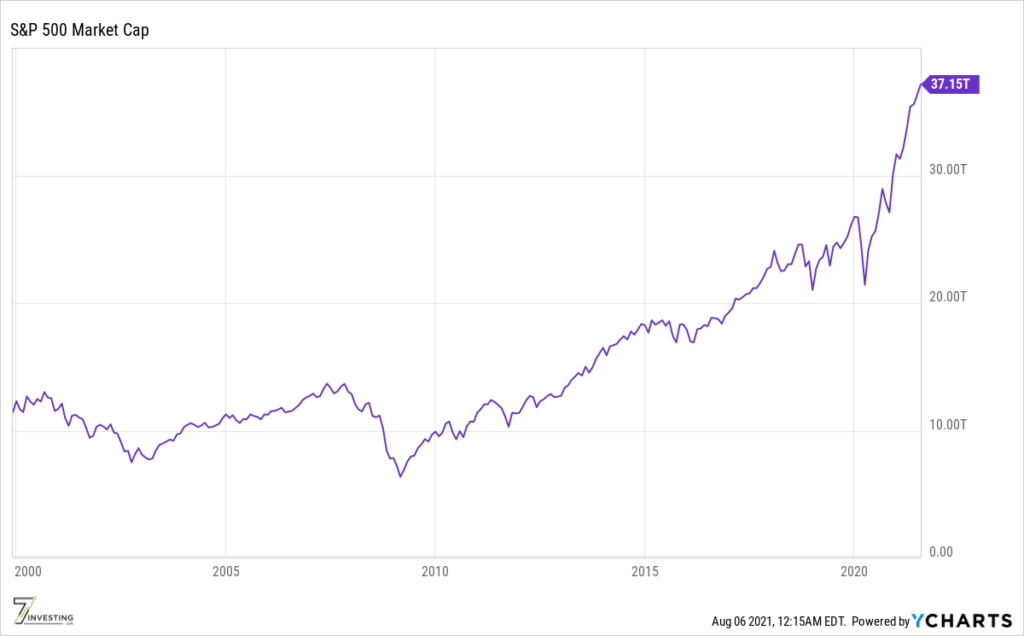
As an example, let’s define Mr. Market to be the S&P 500 index. The index’s total market capitalization was around $11.7 Trillion in January 2000. Thus, an average S&P 500 company’s market capitalization was roughly $23 Billion. Today, the index’s total market cap is $37.2 Trillion, for an average market cap of about $74 Billion. That’s roughly 3x of the value in the early 2000s.
Today, many sub $50 Billion market cap businesses are fast-growing enterprises with long runways for growth. Many are not yet profitable and there’s no likelihood of dividends anytime soon. As such, I don’t think it makes sense to stick with category ranges we have historically used to separate small, mid, large, and mega caps.
So what should we do?
If it were up to me, I would restrict the mega cap tag to exceptional companies. The trillion-dollar market cap threshold seems like the milestone to use. These are elite companies, the cream of the crop, businesses that are category-defining and crushing, both at the same time. Mega caps should be relatively rare, and 1% of the S&P 500 seems like a good fit.
Given I am proposing to move the mega cap boundary by 5x, we can use the same factor to adjust the other definitions. Thus, large caps would range between $50 Billion to $1 Trillion, mid caps would be from $10 Billion to $50 Billion, and small caps would be companies with less than $10 Billion market cap.
| Category | Market Capitalization Range | New proposal |
| Mega Cap | Greater than $200 Billion | Greater than $1 Trillion |
| Large Cap | $10 Billion to $200 Billion | $50 Billion to $1 Trillion |
| Mid Cap | $2 Billion to $10 Billion | $10 Billion to $50 Billion |
| Small Cap | $300 million to $2 Billion | Less than $10 Billion |
I believe these revised ranges better reflect what we intuitively think these classes should represent. Today about 30% of the S&P 500 index consists of companies with $50 Billion or more market capitalization. Then, as per our revised consideration, about 60% of the S&P 500 are mid cap companies, with a small number in the small cap zone.
So there you have it. Maybe your next “large cap” investment is actually a “mid cap”!

Already a 7investing member? Log in here.