The Trade Desk is Worth $62 Per Share. Here’s Why.
Is the stock of this digital advertising innovator significantly overpriced? We dug deep and let the numbers do the talking.
April 25, 2024
See my previous Discounted Cash Flows last month for Coupang and Rocket Lab.
Digital advertising is an industry that moves at the speed of money.
Ad budgets that used to go to print newspapers, radio, and linear television are transitioning to internet display ads, podcasts, and streaming channels.
Consumers preferences and technology changes quite have a say as well. Privacy concerns about Big Tech hoarding user data have led to regulations and lawsuits, while the deprecation of the third-party cookie has large tech companies searching for a more user-friendly identifier to help place personalized advertisements.
One innovative company who’s made a name for itself in the digital world is The Trade Desk (Nasdaq: TTD).
As a demand-side programmatic platform, it helps large advertisers place the right ads in front of the right people on the right devices. “Programmatic” means that there are fine-tuned AI algorithms winning bids and placing ads in less than half a second, without requiring any human oversight.
Many investors are already quite familiar with The Trade Desk, whose stock has increased 26-fold since its 2016 initial public offering. Even in this fast-moving industry, it has been a perpetual winner — always finding ways to stay ahead of the competition and outperform even lofty expectations.
Yet there’s also another word that often get thrown into the discussion whenever we’re talking about The Trade Desk. And that word is “overpriced”.
Critics and bears are quick to point out that even though this is a fantastic company, its stock now sells at a Price/Sales multiple of more than 20x and a Price/Earnings multiple of more than 200x.
Those are rich multiples to pay, even for the best-in-breed. Even incredible companies can turn out to be lousy investments if we vastly overpay for their shares.
So is all of the good news already fully priced in to The Trade Desk’s stock? What’s a reasonable price for us to pay for TTD shares?
Introducing the Discounted Cash Flow Valuation
To answer those questions, we need to bring in a useful new tool.
Doing so involves a discounted cash flow analysis. A DCF estimates future free cash flows — i.e. the cash that a company generates after paying all of its operational and capital costs — and then discounts them to the present day. The end result is a fair value, representing what that shares are worth for investors to pay to be the owners of those future free cash flows.
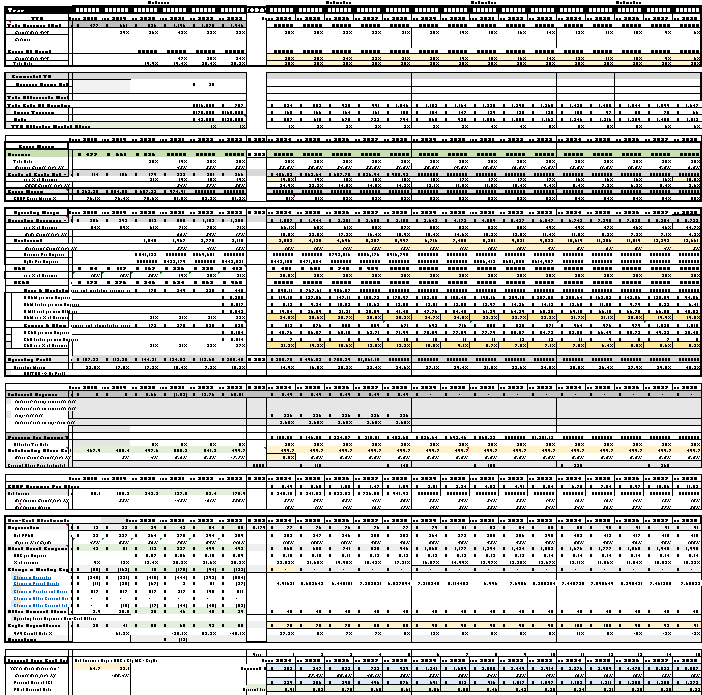
DCF models are the primary way that Wall Street firms set price targets for stocks. They’re not simple and are a huge time commitment to do properly. Here’s a quick look at the financial magic and voodoo that’s being run in the models.
This past month, I’ve published DCFs on small-satellite launch provider Rocket Lab (Nasdaq: RKLB) and on South Korean e-commerce leader Coupang (NYSE: CPNG). I came to the conclusion that Coupang is worth $19.25 and appears fairly valued. Yet I also concluded that Rocket Lab was worth $22 per share and appears to be significantly undervalued.
Just as before, I build my DCF models from scratch. I don’t look at other reports or price target estimates because I want to avoid any bias. My inputs are purposely conservative, to result in a price target that investors should be very comfortable in paying. Using conservative assumptions will ultimately result in a lower price target, though certain drivers could provide significant additional upside if they come to fruition.
So all of that said, let’s jump right to the punchline. I believe The Trade Desk’s stock is worth $62.55 per share.
The stock is trading hands at $82 this morning, which suggests that shares are quite a bit overvalued. But as I’ll discuss in the following sections, The Trade Desk innovates quickly and tends to find ways to outperform expectations.
And before we get into the trenches of my entire model, I’d like to quickly promote our 7investing service.
This article contains institutional-grade research and is only possible to be published for free because of our generous paying subscribers. If you find value in this article, please consider sharing it on social media to help our brand awareness or joining 7investing for just $1 to get similar research reports on all of our official stock recommendations.
Your 7investing membership also includes complete access to our Community Forum, where our advisors and other investors are discussing stocks on a 24/7 basis.
Now, let’s get into the details of my Trade Desk DCF.
7investing’s Discounted Cash Flow model for The Trade Desk
Inputs and Assumptions
Revenues
As a demand-side platform (DSP), The Trade Desk provides a way for advertisers to place their ads within others’ websites, podcasts, and connected TV streaming channels. The company takes a portion of the gross ad spend — knows as the “take rate” — in exchange for placing the ads and providing the analytics.
The Trade Desk doesn’t directly control how much their customers’ spend on advertising. Their willingness to place ads is much more a function of the state of the economy and how well consumers are responding.
As such, I’ve modeled The Trade Desk’s revenues using a “top down” approach. I’ve first made a higher-level forecast about the advertising spend across a variety of formats, and then drilled-down into smaller sub-sectors.
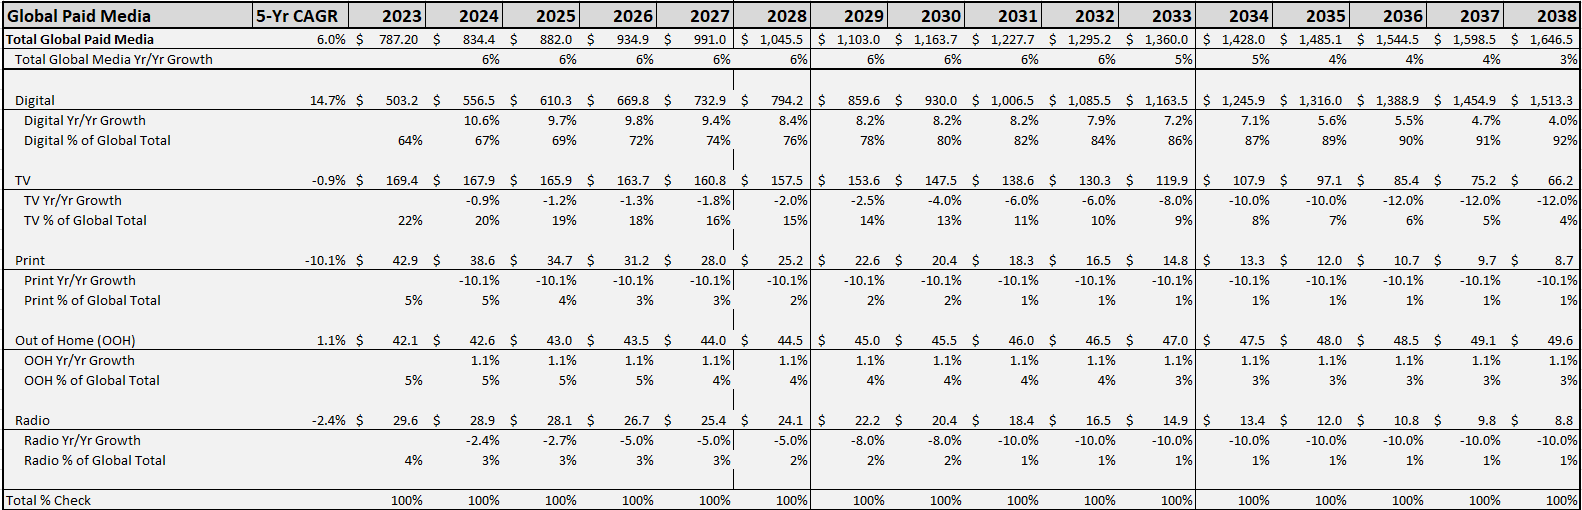
Here are my assumptions used to estimate the global ad market’s total spend:
Global Ad Spend can be classified into five categories: Digital, TV, Print, Out of Home (billboards), and Radio.
I forecast Total Global Ad Spend will grow 6% in 2024 and remain mid-single-digits for most years. It will gradually decline to 3%, hitting $1.6 trillion by 2038. That’s an overall compound annual growth rate of 4.6% per year during my 15 year forecast.
Out of Home will continue to grow slowly, at just 1% annually throughout my DCF window. TV, Print, and Radio all see ad budgets decline; primarily because these budgets move to digital.
Digital Ad Spend will be the fastest-growing category, growing at 10% in 2024 and moderately slowing to 4% by 2038.
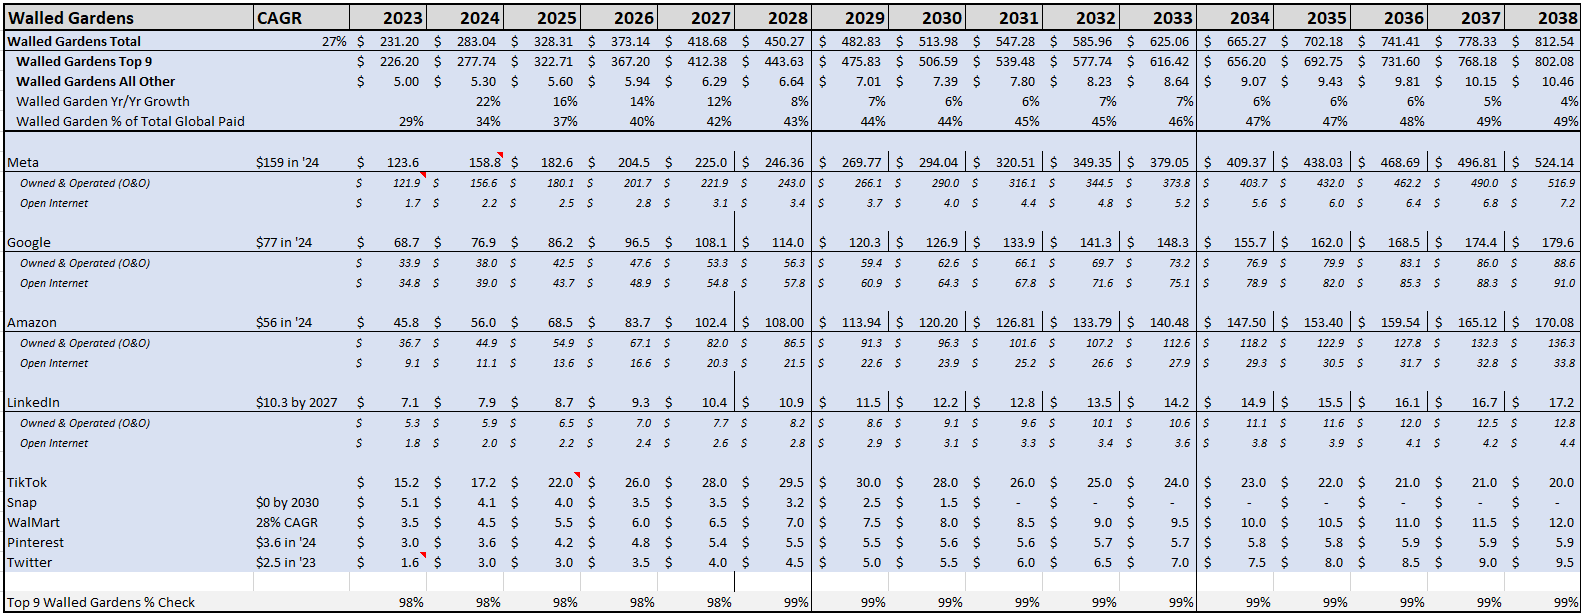
That fast-growing Digital Ad Spend category is the most interesting for this discussion, and it can be further broken down into five sub-segments:
Walled Gardens (29% of total Global Ad Spend in 2023) – Owned & operated sites like Facebook or YouTube, where the company sets the pricing and collects all of the advertising revenue.
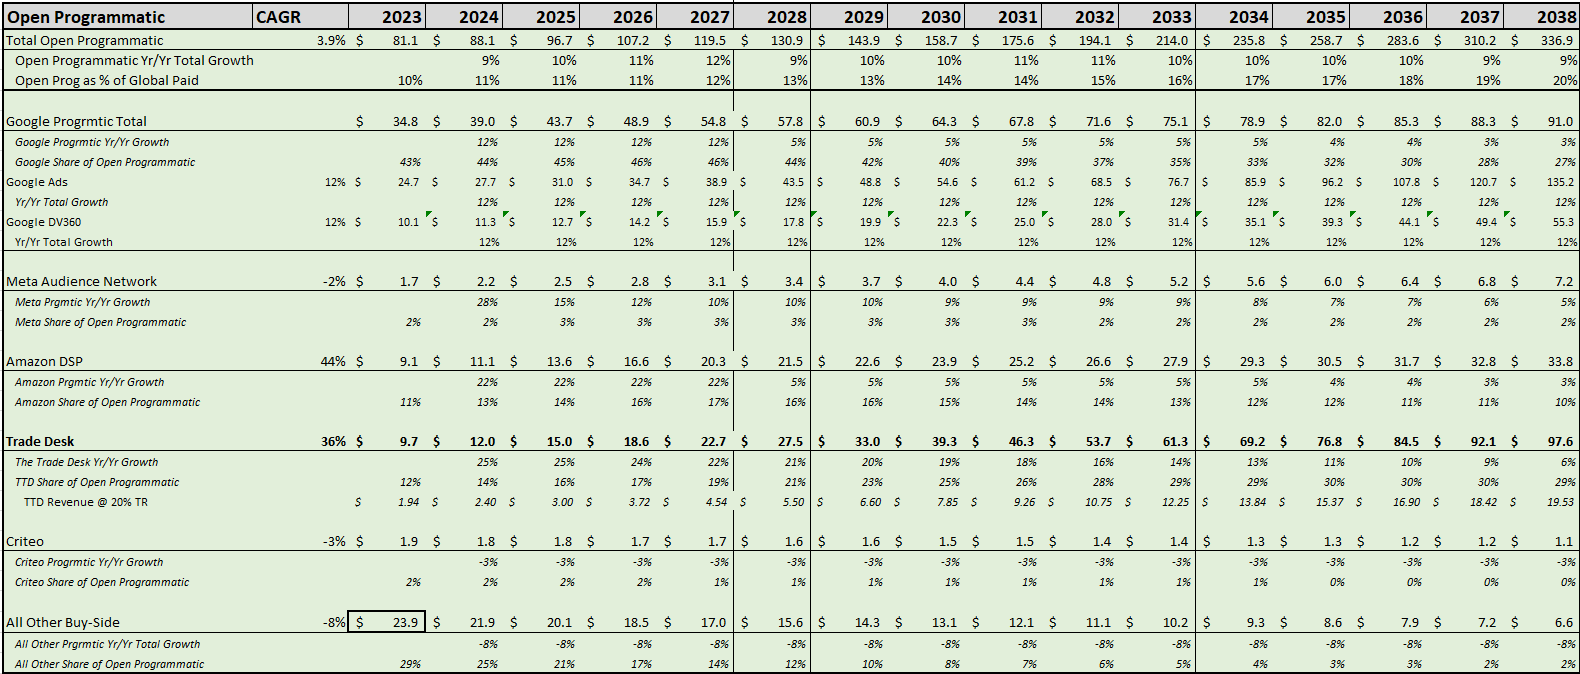
Open Programmatic (10%) – Platforms like The Trade Desk that place ads on other publishers’ sites and collect a take rate fee for doing so.
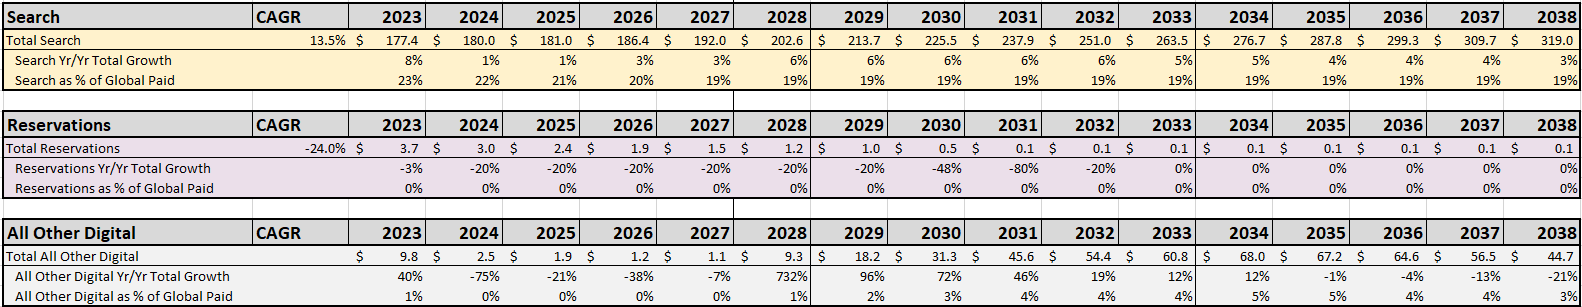
Search – (23%) – Search platforms like Google or Bing where paid ads are for companies to appear in search results.
Reservations (1%) – Direct placements into publishers’ inventory with agreed upon pricing and duration
All Other (1%) – Not accounted for in any of the above.
I have a lot of thoughts about a lot of those segments.
Many believe the “walled gardens” will crumble down, due to their lack of price transparency and regulators hating Big Tech companies hoarding personal information.
I don’t necessarily buy that. I believe our internet was created in a way so that we could visit websites for free, which means they needed their costs to be subsidized by advertising. The walled gardens — which provide our every day web browsing activities like search, social media, music, and video streaming — are able to exist because of advertising.
I think the Walled Gardens — especially Meta, Google, and Amazon — will continue to grow at double-digit rates for at least the next five years. Also worth noting: the world’s nine largest walled gardens (listed below) account for 98% of the total global revenues of this category.
The Trade Desk is part of the Open Programmatic category. This allows large platforms to place advertisements into others’ sites that they do not directly own or operate, then charge a take rate of 10-20% for placing the ads and providing the analytics.
The Trade Desk’s job is to use data to give advertisers and edge and an attractive return on their total ad spend. They train their AI with as much data as possible, to optimize whatever outcome is requested by their customers (page views, clicks, conversions, etc). Customers get used to the platform and tend to stick around and spend more over time.
This is a winner-take-most market, and I expect The Trade Desk and Google will be a two-horse race when it comes to the DSP buy-side.
The entire Open Programmatic segment will grow at 10% annually as advertisers transition their budgets from traditional TV, Print, and Radio. But there will also be a market share shift within Open Programmatic, as smaller Buy-Side platforms can’t compete with the sheer amount of data and ROI efficiency of the larger players.
I estimate The Trade Desk will place $97 billion of gross ad spend by 2038 and capture $19 billion in revenue from that (a 20% take rate).
Elsewhere, I see Search maintaining its 20% market share of total ad spend even in the ChatGPT-world. And direct reservations will become inefficient and unnecessary by the end of the decade.
This top-down ad industry forecast results in $2.4 billion of Trade Desk revenue in 2024, which will increase to $19.5 billion in 2038.
Costs of Goods Sold
The Trade Desk’s costs of goods sold are primarily the computing infrastructure and support required for the massive amount of impressions they’re serving and data they’re processing. This is something that can moderately scale over time, where revenues outpace the necessary costs.
Gross margin was 81% last year and I expect that will gradually improve to 85% over the next 15 years.
Operating Expenses
The operating expenses is where things get trickier, because The Trade Desk is a people business.
It hires smart software developers to optimize its real-time bidding algorithms. It hires efficient sales people to manage relationship with large advertisers and to close new deals. And it pays its employees — and especially its visionary CEO and founder Jeff Green — very handsomely with bonuses and stock-based compensation.
After scouring through the annual report and the proxy, I determined that employee headcount would actually be one of the key inputs of the DCF model. The vast majority of The Trade Desk’s operating expenses are people-related costs — such as stock-based comp, sales expenses/commissions, international facilities, marketing budgets, and administrative support/overhead.
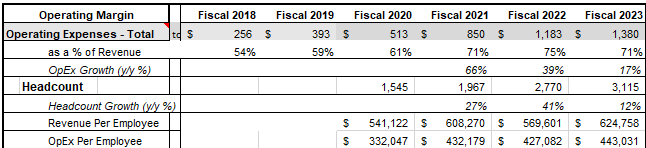
During the past three years, The Trade Desk’s Revenue Per Employee has expanded from $541,122 in 2020 to $624,758 in 2023. Its operating expenses per employee also expanded, from $332,047 in 2020 to $443,031 in 2023.
During those three years, its headcount doubled from 1,545 to 3,115.
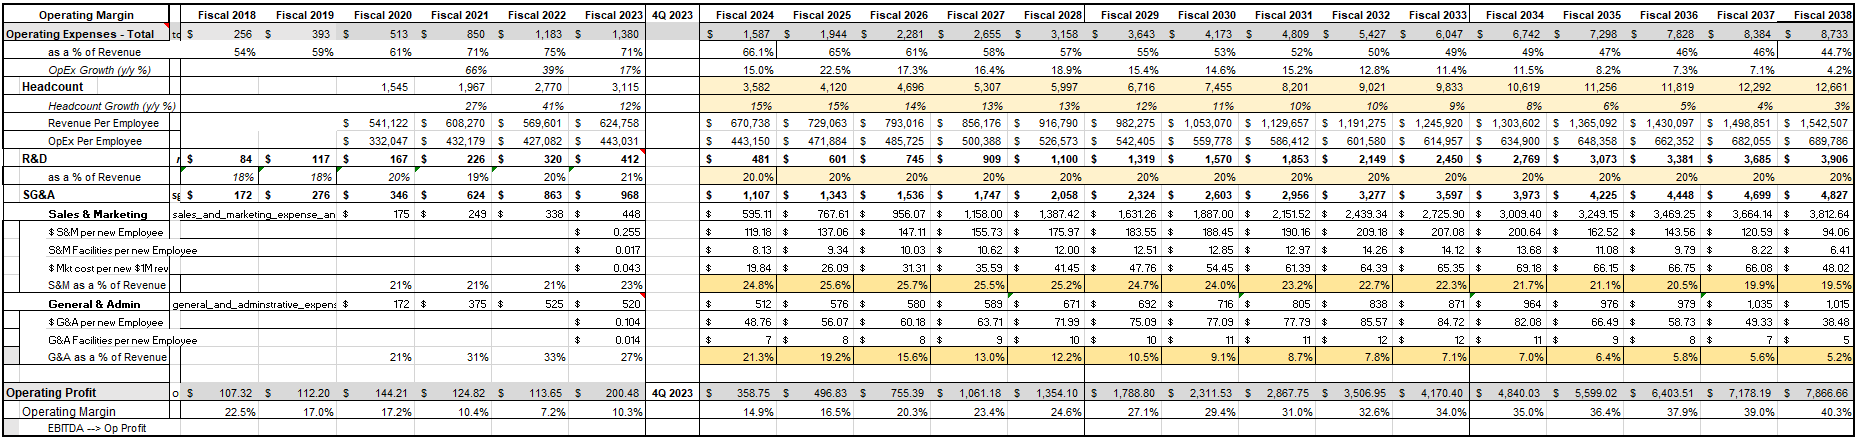
With as much as The Trade Desk talks about international expansion, I don’t expect the hiring to slow down any time soon. I’m modeling for headcount to expand another 15% in 2024 and then taper down slowly over time. I am estimating the company will have 12,661 employees by 2038.
This is an extremely scalable platform; i.e. there’s not as much hand-holding required for customers to spend more money on advertising. I expect Revenue per Employee will increase to $1.5 million by 2038 and Operating Expenses per Employee will increase to $689,000 (including all stock-based compensation).
As I’ll show in the next section, that’s $689,000 per employee isn’t exactly evenly distributed. It’s highly-skewed by the massive stock incentive plan of Jeff Green and the company’s top-brass executives.
Regarding how the operating expenses are categorized:
The Trade Desk has historically kept R&D constant at 20% of total revenue. I believe that’s a specific managerial target, so I’ve kept it constant throughout the forecast.
Sales, General, and Administrative includes stock-based comp, facilities costs, and marketing budgets. I took the increase in each of these during 2023 and divided it by the new employees hired, to estimate the Opex burden per new employee.
SG&A as a percentage of revenue declines from 50% in 2023 to just 25% in 2038, while GAAP operating margin increases from 10% in 2023 to 40% in 2038.
Green’s Incentive Plan and Stock-Based Compensation
10% last year to 40% in 2038 is a huge increase in profitability! What’s the catch??
A huge portion of The Trade Desk’s operating expenses are the Stock-Based Compensation expense that is tied to CEO Jeff Green’s incentive plan.
Green gets a boatload of stock-based comp, but only if his company’s stock hits certain price thresholds. Due to GAAP accounting requirements, The Trade Desk must estimate a certain portion of those in each upcoming fiscal year, even if the stock doesn’t hit the threshold and the new shares don’t get issued. If they don’t trigger, the company reduces its actual stock-based compensation expense for the year.
Here’s an example of how that looked, from 2023:
“General and administrative expense decreased by $5 million, or 1%, for the year ended December 31, 2023, as compared to the year ended December 31, 2022. The decrease was primarily due to a $47 million decrease in stock-based compensation, partially offset by increases of $36 million in personnel costs and $5 million in allocated facilities costs.
The decrease in stock-based costs was primarily driven by a $64 million decrease in stock-based compensation cost related to the CEO Performance Option driven by the graded-vesting attribution method, under which more expense is recognized earlier in the option’s life.”
The point here is that the vesting of Green’s stock options based upon The Trade Desk’s share price will have an actual impact on the valuation of the company.
It’s difficult to make assumptions around this. Nostradamus isn’t in my lineage and I have no idea what price TTD’s stock will trade hands at here in the near-term. But I do think a reasonable assumption is that the price target thresholds will trigger every third year. Meaning Green’s shares would execute in 2025, 2028, 2031, and so on.
Accounting for this into a DCF model is more art than science. But the important punchline is that stock-based compensation will be lumpy on an annual basis. It spiked in 2021/2022 when Green’s first traunche got executed. But then it actually decreased year-over-year in 2023 because it didn’t hit the next target.
Another important consideration is that The Trade Desk is offsetting any dilution by immediately repurchasing shares issued as stock-based compensation.
Its share count has remained at around 500 million for the past three years. They’ve done that, even after issues stock-based comp, by authorizing repurchases of those new shares that are issued. They have a $700 million buyback authorized and ready to deploy, to offset any shares that might be issued this year.
Typically when companies pay stock-based comp, we just treat it as a non-cash expense. It’s added back to the cash flows, but we also increase the overall share count accordingly.
But because The Trade Desk is buying back all of its newly-issued shares, that means SBC is really more of a cash expense. It’s essentially the company paying cash to the employees/executives, in an equivalent value of what the shares are worth.
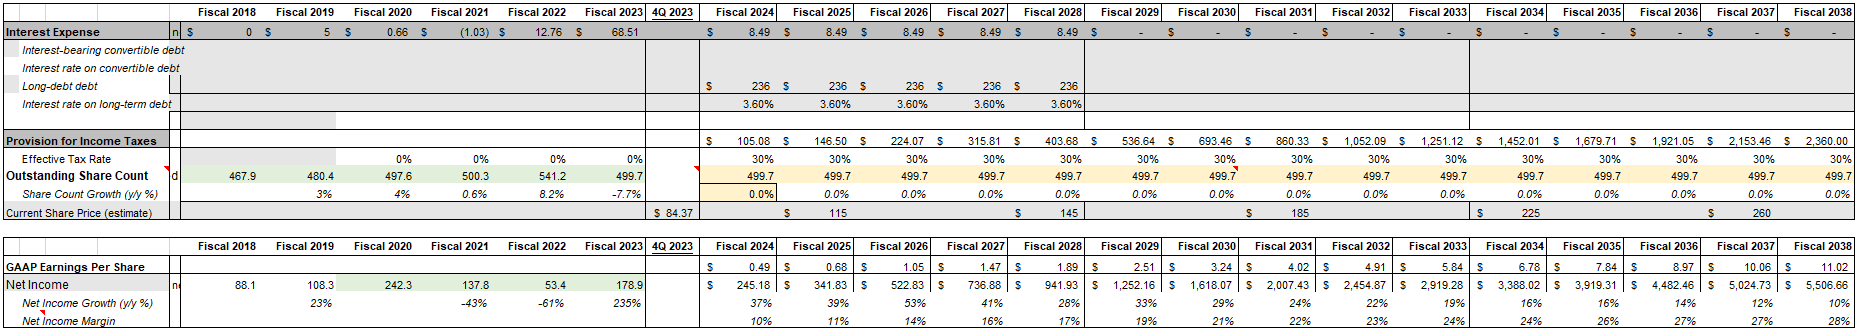
So this cash expense will reduce free cash flow in future years. I’m holding the outstanding share count constant at 499.7 million and am not adding back the SBC amounts when making the free cash flow calculations.
Non-Cash Adjustments and Other Assumptions
A few more odds-and-ends:
TTD has a capital lease agreement that I’m treating as long-term debt. It’s estimated at 3.6% cost of debt and a five-year term; fully repaid by 2029.
I believe the share price will hits the Green comp plan triggers every third year. $115 per share by 2025, $145 by 2028, etc.
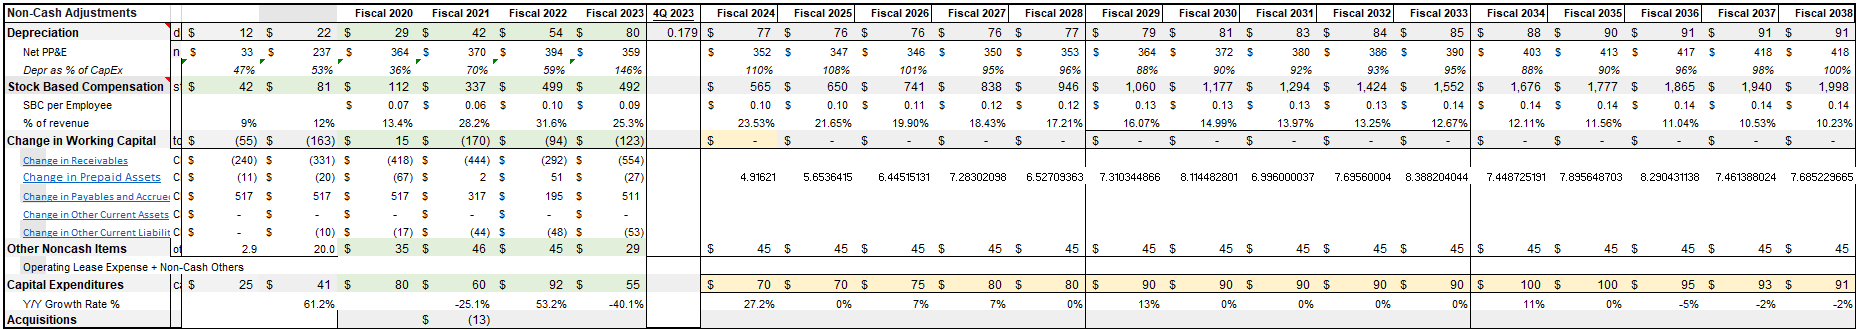
CapEx is tied to international expansion and infrastructure, increasing from $60 million in 2021 to $92 million in 2022, but then falling to $55 million in 2023. I’ve estimated $70 million in CapEx for 2024, rising to $100 million by 2034 and then settling back to maintenance-only CapEx by 2038.
No acquisitions and no long-term debt borrowing. I believe the company’s expansion will be organically funded.
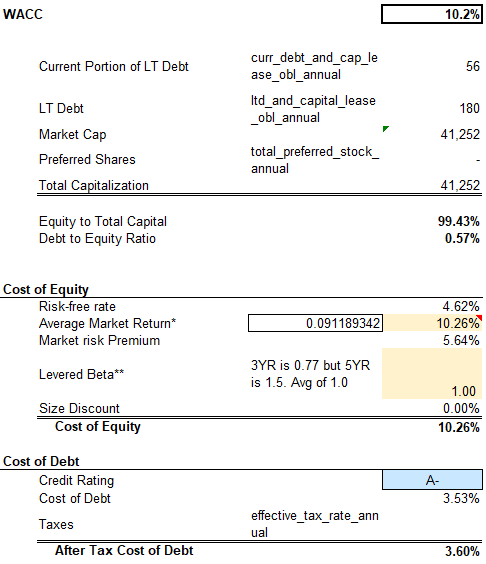
I used a discount rate of 10.2%. The Trade Desk has no long-term debt and is almost fully-funded by equity. I calculated the WACC using an average market return of 10.3% and a Beta of 1.0 (The Trade Desk’s 3-year Beta is 0.77 and its 5-year Beta is 1.5).
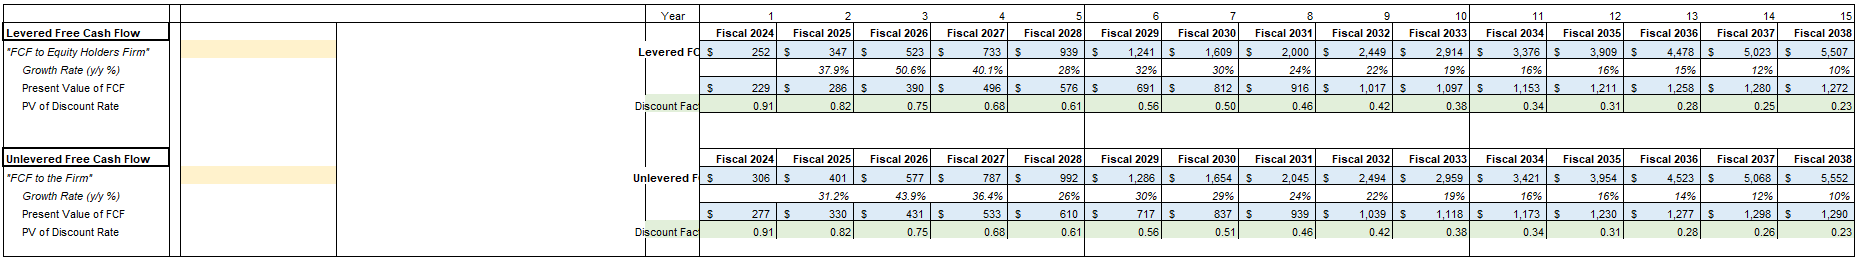
I used a 15 year growth window and assumed a terminal growth rate of 3% for the cash flows beyond 2038. I then discounted all of those future cash flow back to the present.
So What’s The Trade Desk Worth?
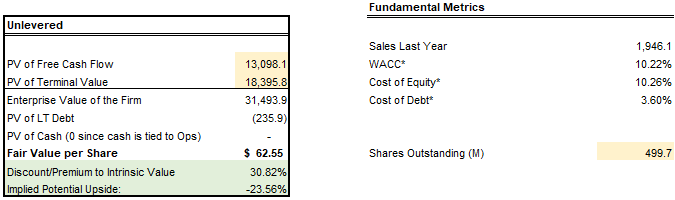
So now that we’ve gone through all of the inputs, let’s circle back to that punchline. I estimate The Trade Desk’s present equity value is worth $62.55 per share.This represents the fair value of what The Trade Desk’s shares are worth today.
The Trade Desk’s current stock price of around $82 suggests that shares are a bit overvalued. That’s pretty much been par for the course though, as this company always feels expensive and yet always tends to outperform expectations.
One Ace it has up its sleeve could be its OpenPath initiative, which allows large advertisers to directly place ads into open inventory offered by large publishers like Disney. This would bypass the traditional real-time bidding auctions entirely, saving advertisers from inefficient/wasted spending and rewarding The Trade Desk with a larger take rate of their overall budget.
Another upside to this $62 price target could come from faster than expected revenue growth. The Trade Desk could more aggressively take share from other buy-side platforms, or charge higher than 20% take rates due to placing premium ad formats like videos into streaming channels. Lastly, it could require fewer employees and operating costs in order to achieve the growth projections of the model.
All of this is just the beginning. DCFs evolve over time and I’ll be updating my model accordingly to keep up with the digital ad industry’s ongoing changes.
I’ll be sharing all of those updates on our 7investing Community Forum. And I’d love to invite you to join in on the conversation.
Want to discuss Simon’s assumptions on The Trade Desk directly with him and with other investors?
“Thanks a lot, Simon, for all the work. It would have surprised me if the stock was fairly valued or undervalued given it’s P/S ratio above 20 and “relatively modest” growth for that multiple. The discussion on SBC and the headcount that you provided were quite interesting. I don’t have a full position yet but am not building up at these prices.”
“Thanks for doing this. So much work goes into these models, that this kind of financial calculus on individual stocks is worth the price of admission by itself.”
“Thanks a lot for working through this publicly, really an excellent exercise.”
This is a great company but an average stock at this moment in time. If you build out a position at these prices it will likely take great execution and time to outperform the market. It is a tremendous company so when the stock experiences significant corrections I add trade positions. But I trim them back away upon recovery.
“Thanks for the modeling!”
“Thanks for the hard-work, 7innovator! Would be interesting to see if this impacts the conviction rating..”
These are actual posts from actual members in our Community Forum. Click here to join 7investing’s Community Forum today!